Cloud monitoring in AWS is often reduced to dashboards and alerts, but in practice it is the backbone of operational resilience and security assurance, especially in distributed IoT systems. In low power IoT deployments such as LoRaWAN based agriculture networks, edge assisted sensing platforms, or microgrid testbeds, telemetry does not stop at the gateway. It flows into cloud services where it is processed, stored, analyzed, and acted upon. Monitoring in this context is not only about uptime. It is about traceability, anomaly detection, compliance evidence, and understanding system behavior under constrained and adversarial conditions.
At the foundation of this visibility layer is Amazon CloudWatch Logs, which aggregates logs from EC2 instances, containers, Lambda functions, and even custom IoT ingestion pipelines. In an IoT architecture, device telemetry may enter through IoT Core or API endpoints, get processed by serverless functions, and then stored in databases or analytics engines. CloudWatch Logs becomes the unified collection point where processing errors, authentication failures, dropped packets, and latency spikes are recorded. For large scale sensor deployments, log insights queries allow engineers to correlate spikes in ingestion errors with firmware updates or gateway outages. This becomes especially important when investigating potential security anomalies such as repeated join attempts in LoRaWAN or malformed payload submissions from edge nodes.
Monitoring becomes significantly more powerful when observability data triggers automated responses. Amazon EventBridge acts as the event driven nervous system that connects telemetry to action. Rather than treating logs as passive records, EventBridge enables pattern matching on operational or security events and routes them to remediation workflows. In an IoT security scenario, detection of abnormal API calls, excessive device reconnect attempts, or unexpected configuration changes can trigger Lambda functions that isolate resources, notify administrators, or update firewall rules. This shift from reactive monitoring to event driven orchestration is critical in environments where thousands of devices operate simultaneously and manual intervention is not scalable.
Security visibility at the control plane level is strengthened through AWS CloudTrail, which records every API call across the AWS environment. For IoT researchers and architects, CloudTrail provides forensic depth. It answers questions such as who modified an IoT policy, when a gateway configuration was altered, or which IAM principal accessed sensitive telemetry data. In regulated environments such as smart healthcare or critical infrastructure monitoring, CloudTrail logs become part of compliance evidence. When integrated with CloudWatch and EventBridge, suspicious administrative activity can trigger automated containment, turning audit trails into active defense mechanisms.
As IoT systems grow more complex, distributed tracing becomes essential. AWS X-Ray provides end to end visibility into request paths across microservices and serverless components. In a typical edge to cloud pipeline, a sensor event may pass through ingestion endpoints, validation services, enrichment layers, storage systems, and analytics engines. Latency or failure at any point affects real time decision making. X Ray traces these interactions, allowing engineers to pinpoint bottlenecks or misconfigurations. For time sensitive IoT applications such as grid fault detection or environmental hazard monitoring, understanding service level latency is not a luxury but a reliability requirement.
Monitoring is not only about infrastructure and request flows. Code quality and performance also influence system resilience. Amazon CodeGuru applies machine learning to analyze application code and runtime behavior. In IoT backends that process high volume telemetry streams, inefficient code can silently introduce scaling issues or cost overruns. CodeGuru identifies resource leaks, concurrency problems, and performance inefficiencies before they manifest as production incidents. For researchers building anomaly detection or lightweight ML inference pipelines in the cloud, this layer of automated review helps maintain both performance and operational integrity.
Beyond individual services, operational awareness must include the health of the cloud provider itself. AWS Health Dashboard provides visibility into AWS service disruptions and maintenance events. In IoT systems deployed across multiple regions, regional service degradation can affect data ingestion or device connectivity. By integrating health notifications into monitoring workflows, architects can design failover strategies that reroute traffic or buffer data at the edge. This reinforces a key principle in IoT system design: resilience requires awareness not only of devices and applications, but also of the underlying cloud fabric.
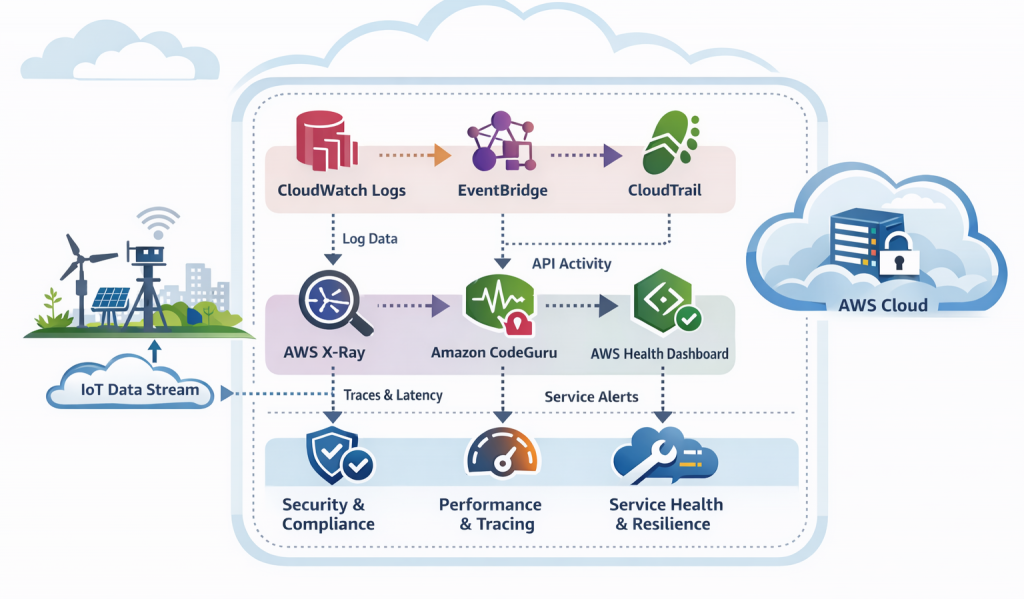
When woven together, these services form a layered observability architecture. CloudWatch captures operational signals, EventBridge transforms signals into automated action, CloudTrail provides audit depth, X Ray exposes distributed behavior, CodeGuru strengthens code reliability, and the Health Dashboard contextualizes platform stability. For IoT researchers and practitioners, this integrated monitoring approach supports both experimentation and production readiness. It enables traceable security models, measurable performance metrics, and defensible architectures.
In modern IoT deployments, especially those concerned with security and constrained environments, monitoring is not an afterthought. It is an architectural pillar. Effective cloud monitoring in AWS provides the visibility required to detect anomalies, validate trust assumptions, and maintain operational continuity across the edge to cloud continuum.